Test — Visual Explainer (find #50) on real work: Muse Map v5 re-audit recap
Date: 2026-11-19 · Run in FINDS - TESTS at Ros's direction (asked in MY-VIZ). Prior smoke test (2026-11-17, MY-VIZ) covered a synthetic 32-line sample only; this run uses real material. Subject: Visual Explainer v0.15.0 (nicobailon/visual-explainer, MIT) — skill clone at ~/workspace/visual-explainer-test/visual-explainer/.
What was run
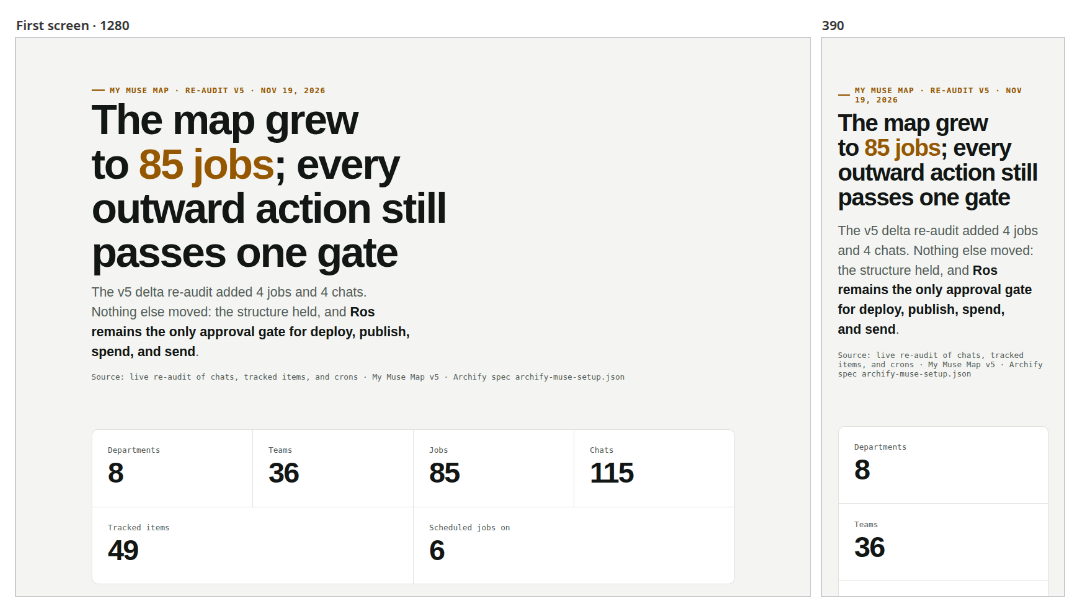
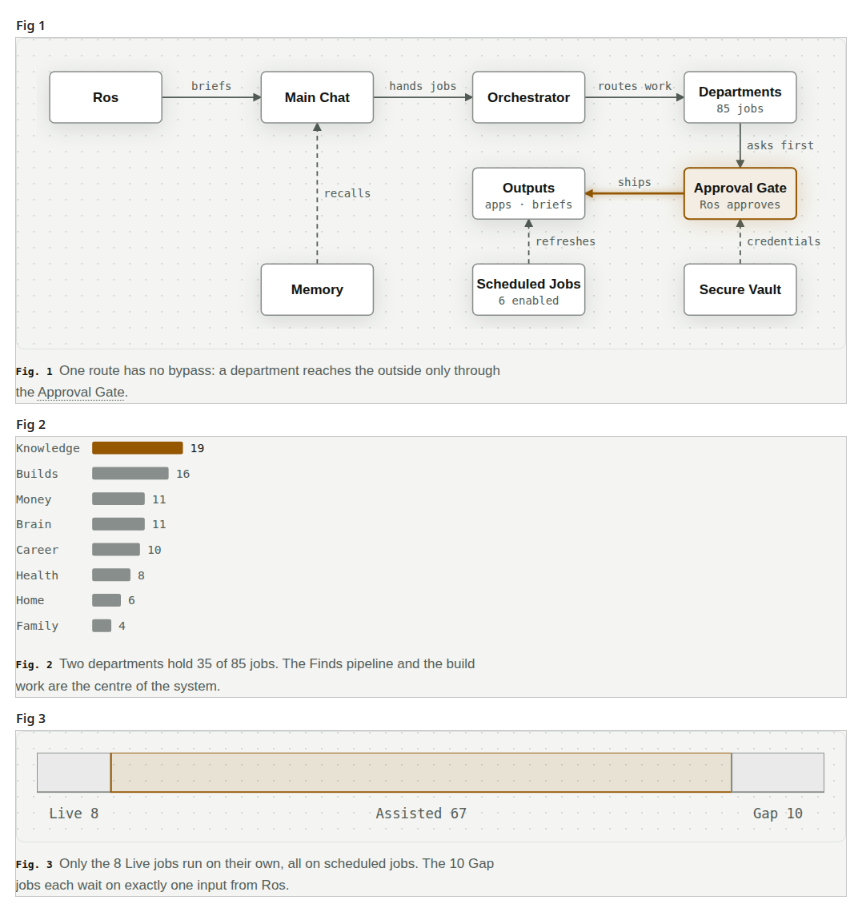
A project-recap / audit page for the Muse Map v5 delta re-audit (Nov 19, 2026) — real, current, and number-dense: Instrument register, KPI strip (8 departments · 36 teams · 85 jobs · 115 chats · 49 tracked items · 6 scheduled jobs), a <ve-flow> system diagram (9 nodes, 8 verb-labelled edges, Approval Gate as key node), <ve-bars> jobs per department, a <ve-stack> Live/Assisted/Gap split, a department ledger table with the v4→v5 deltas, and a <ve-ask> next-step question. Source: muse-map-v5-recap.src.html (7.4 KB hand-authored); rendered output muse-map-v5-recap.html is 65 KB with the kit inlined, self-contained.
Verification
- Facts reconciled before authoring: per-department teams/jobs extracted from the live map data (~/workspace/ts-spaces/my-muse-map/index.html) — jobs sum to exactly 85, teams to 36; deltas match the v5 audit (Career +2: PM - NEWS, PM - AI-OPS-MODEL; Knowledge & Finds +1: FINDS - TESTS; Home & Gear +1: MY - DRONES); status split 8/67/10, 115 chats, 49 tracked, 6 crons, and the Grok-watch regression all match the audit text and the Archify v5 spec (~/workspace/design-skill-tests/archify-muse-setup.json). Every number on the page traces to one of those two sources; sources are cited on the page itself.
- Renderer QA loop, as the skill prescribes: pass 1 rejected the source (8 errors — " jobs" unit overflowed the bars' shared value column; nothing written). Pass 2 rendered but the built-in visual check flagged 6 label/border collisions in the flow figure — including two edges the grid auto-layout had routed so they read as pointing at the wrong nodes (Scheduled Jobs → Secure Vault; Memory → Scheduled Jobs). Pass 3: 2 flags. Pass 4: visual check clean, smallest label 12.01 px at 390 width, 14.01 px at 1280. Fixes were small source edits each time, never a rewrite.
- Final sheet read by eye: every edge lands on the node its verb describes; the gate is the single hot path; figures state their claims in captions.
- Environment note: the renderer's visual check needed the Playwright headless-shell path bridged (cache holds revision 1254, the skill's playwright-core wants 1255; a symlink resolved it and the check ran fully).
Comparison — vs how this output is produced today
- Archify (adopted standard for the Muse Map diagram) renders the same system as an 850 KB interactive architecture artifact: 19 components, 25 connections, per-team depth. It is the reference of record. The Visual Explainer page is a different artifact: a one-screen audit brief — headline verdict, KPI strip, delta ledger, one embedded decision question — readable in under a minute. It deliberately simplifies (9 nodes vs 19 components); that is a feature for a recap and a loss for a reference.
- Effort: ~25 minutes end to end including fact extraction and four render passes; the QA loop is the skill's own, not hand-rolled screenshot scripts.
- Where it beats the hand-built route: the strict renderer catches real defects (label collisions, misrouted-looking edges, value-column overflow) automatically, and the register/kit system gives a disciplined audit look with zero design decisions to re-make per page.
Verdict for find #50
Adopt — scoped. Visual Explainer becomes the standard route for recaps, re-audit briefs, and diff/plan reviews: pages whose job is fast absorption of real state. It does not displace Archify for the Muse Map architecture render, and it does not replace hand-built apps. The 2026-11-17 smoke-test verdict ("works as advertised") is superseded by a real-work pass.
Output reference: ~/workspace/finds-tests/visual-explainer-muse-map-2026-11-19/muse-map-v5-recap.html (source .src.html and contact sheets alongside it).