FINDS - TESTS · Slate 2, Test 3 — Vega-Lite vs Observable Plot (pair test, one survivor)
Date: 2026-11-20 · Baseline: the hand-drawn SVG charts in Ros's Sleep Patterns app
Subjects: Vega-Lite 5.23.0 (+ Vega 5.33.1, vega-embed 6.29.0) vs Observable Plot 0.6.19 (+ D3 7.9.2)
Outputs: vegalite.html, plot.html, sleep-nights.json / sleep-nights.csv, 7 screenshots (this folder)
Dataset reconciliation — expected ~482 nights, actual 301
The brief expected ~482 nights. The app's real dataset is 301 nights, and the extract reconciles exactly:
- Source:
var NIGHTS = [...]embedded in~/workspace/ts-spaces/sleep-patterns/index.html(line 387), Apple Health via HealthKit, grouped by wake day. - Extract: 301 rows, 2026-01-01 → 2026-11-08, fields:
date, total_h, deep_h, rem_h, core_h, unspecified_h, awake_h, efficiency_pct, awakenings, bedtime, wake_time, sessions, weekday— plus derivedcore_plus_h(core + unspecified, the app's third stack segment),bed_off/wake_off(minutes since 18:00, the app's owntimeToOffset),rolling7_h(trailing 7-night mean, the app'srollingSeriessemantics). - Cross-checks against the app's own
SUMMARYobject: nights 301 ✓, sessions 376 ✓, mean total 6.10 h ✓, nights < 6 h = 151 ✓, and all 11 monthly aggregates (nights, avg_h, under-6 count) match to the printed precision ✓. Stage segments sum tototal_hwithin 0.02 h on all 301 nights ✓.
The three charts (the app's own three)
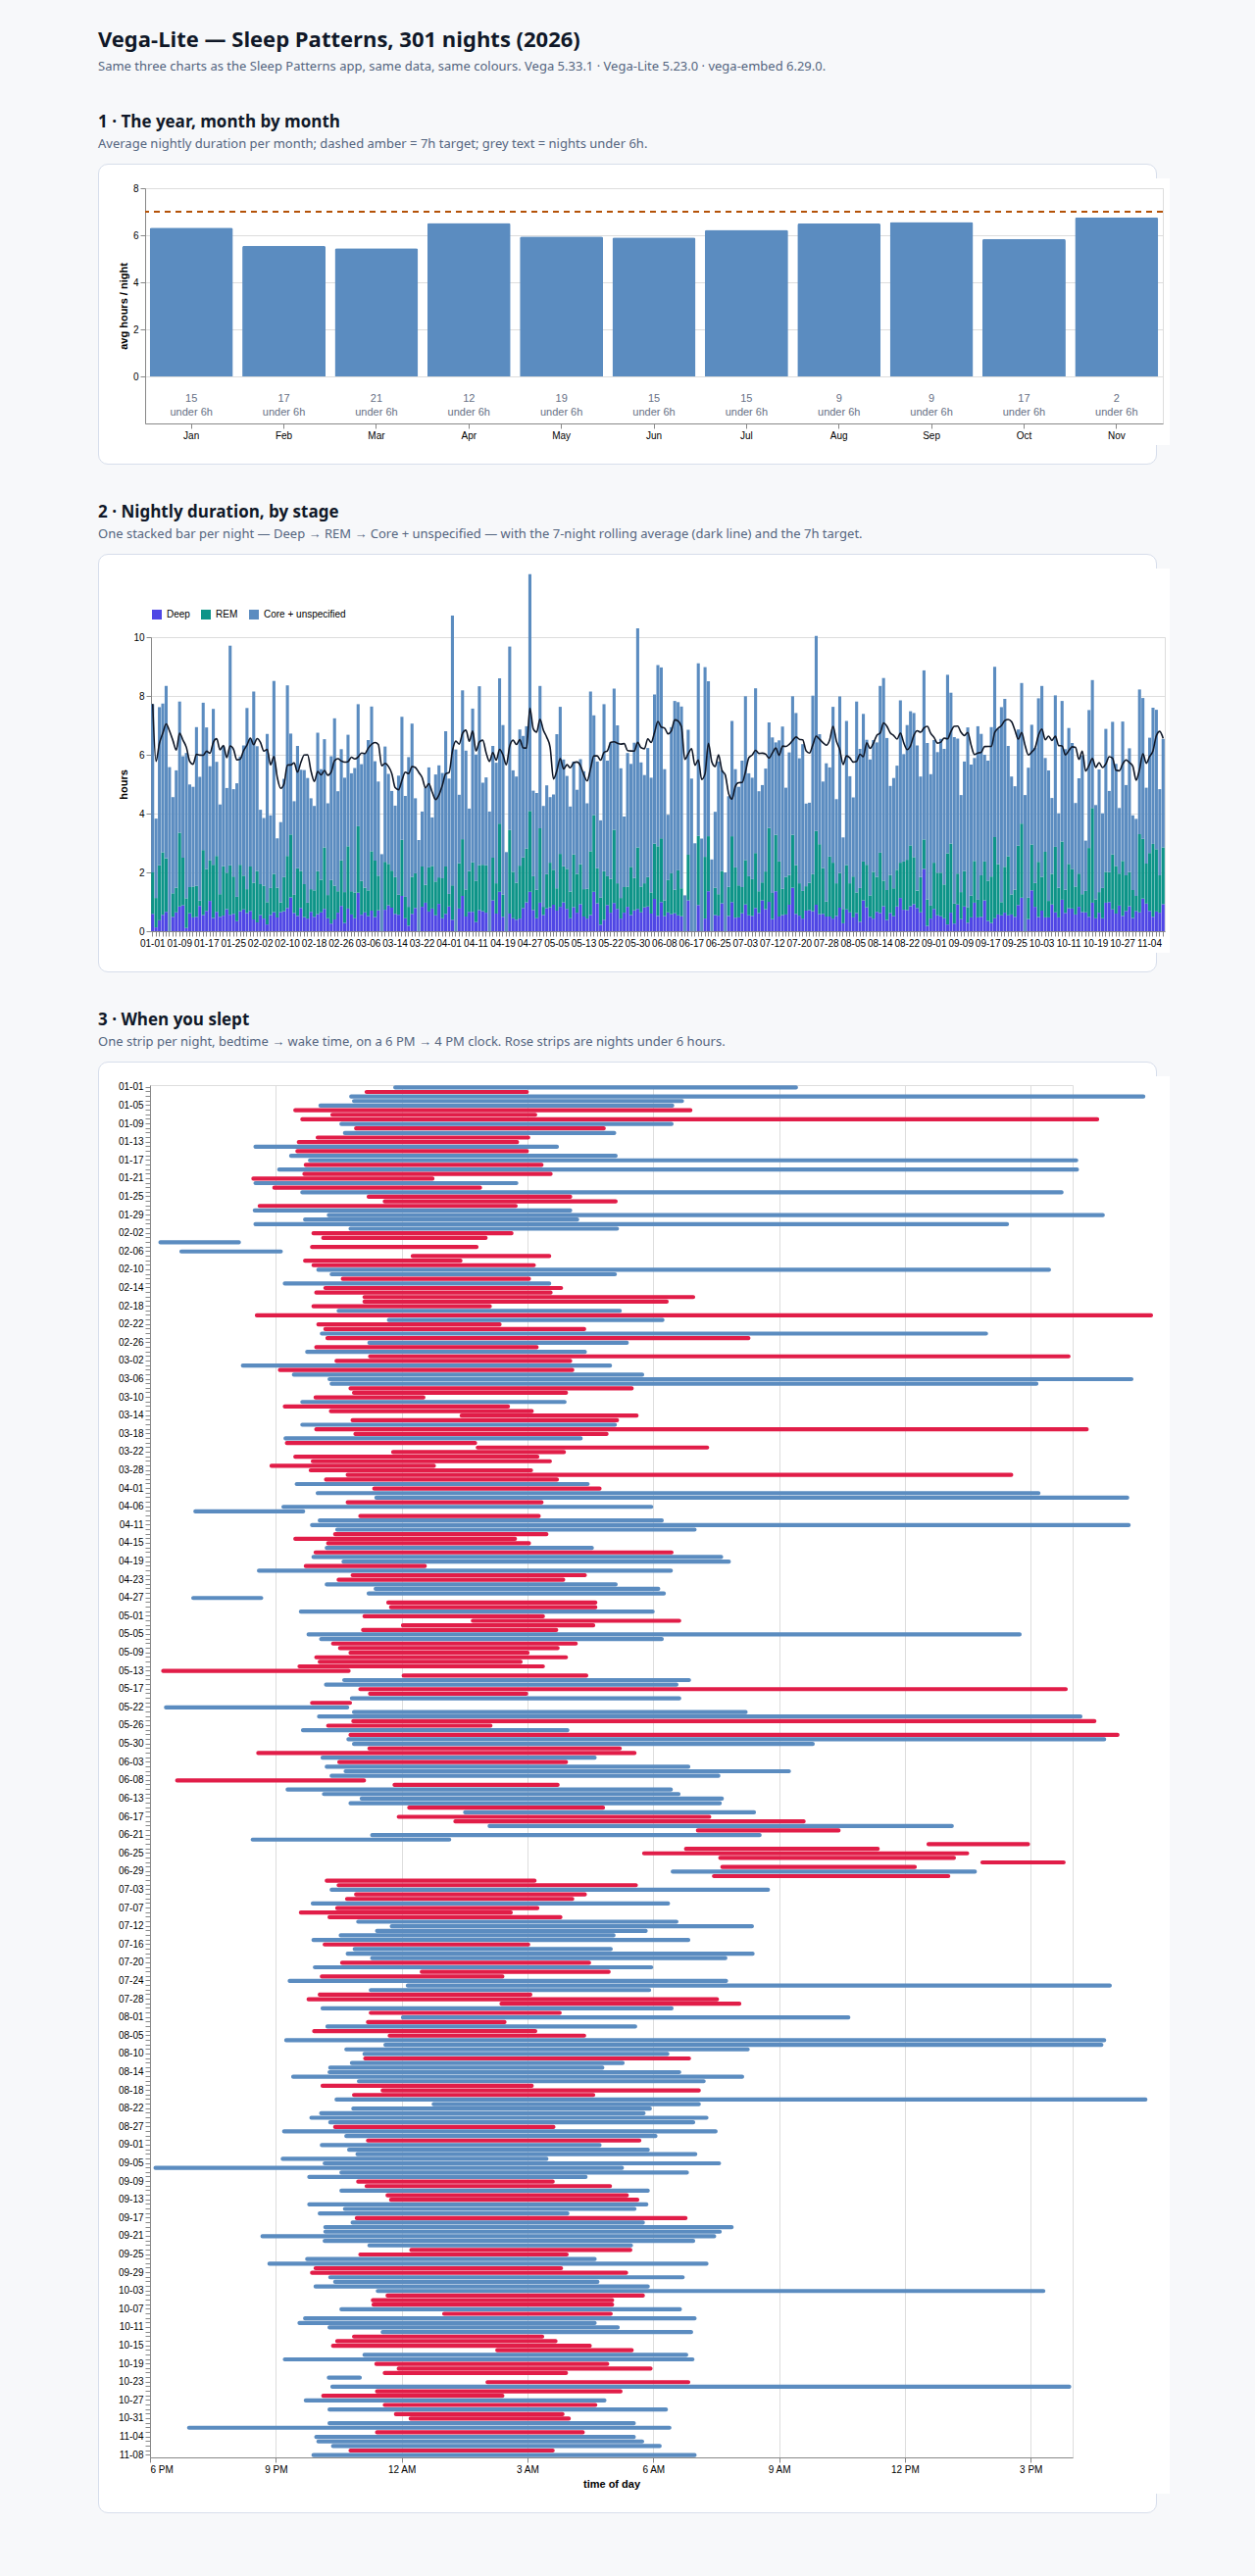
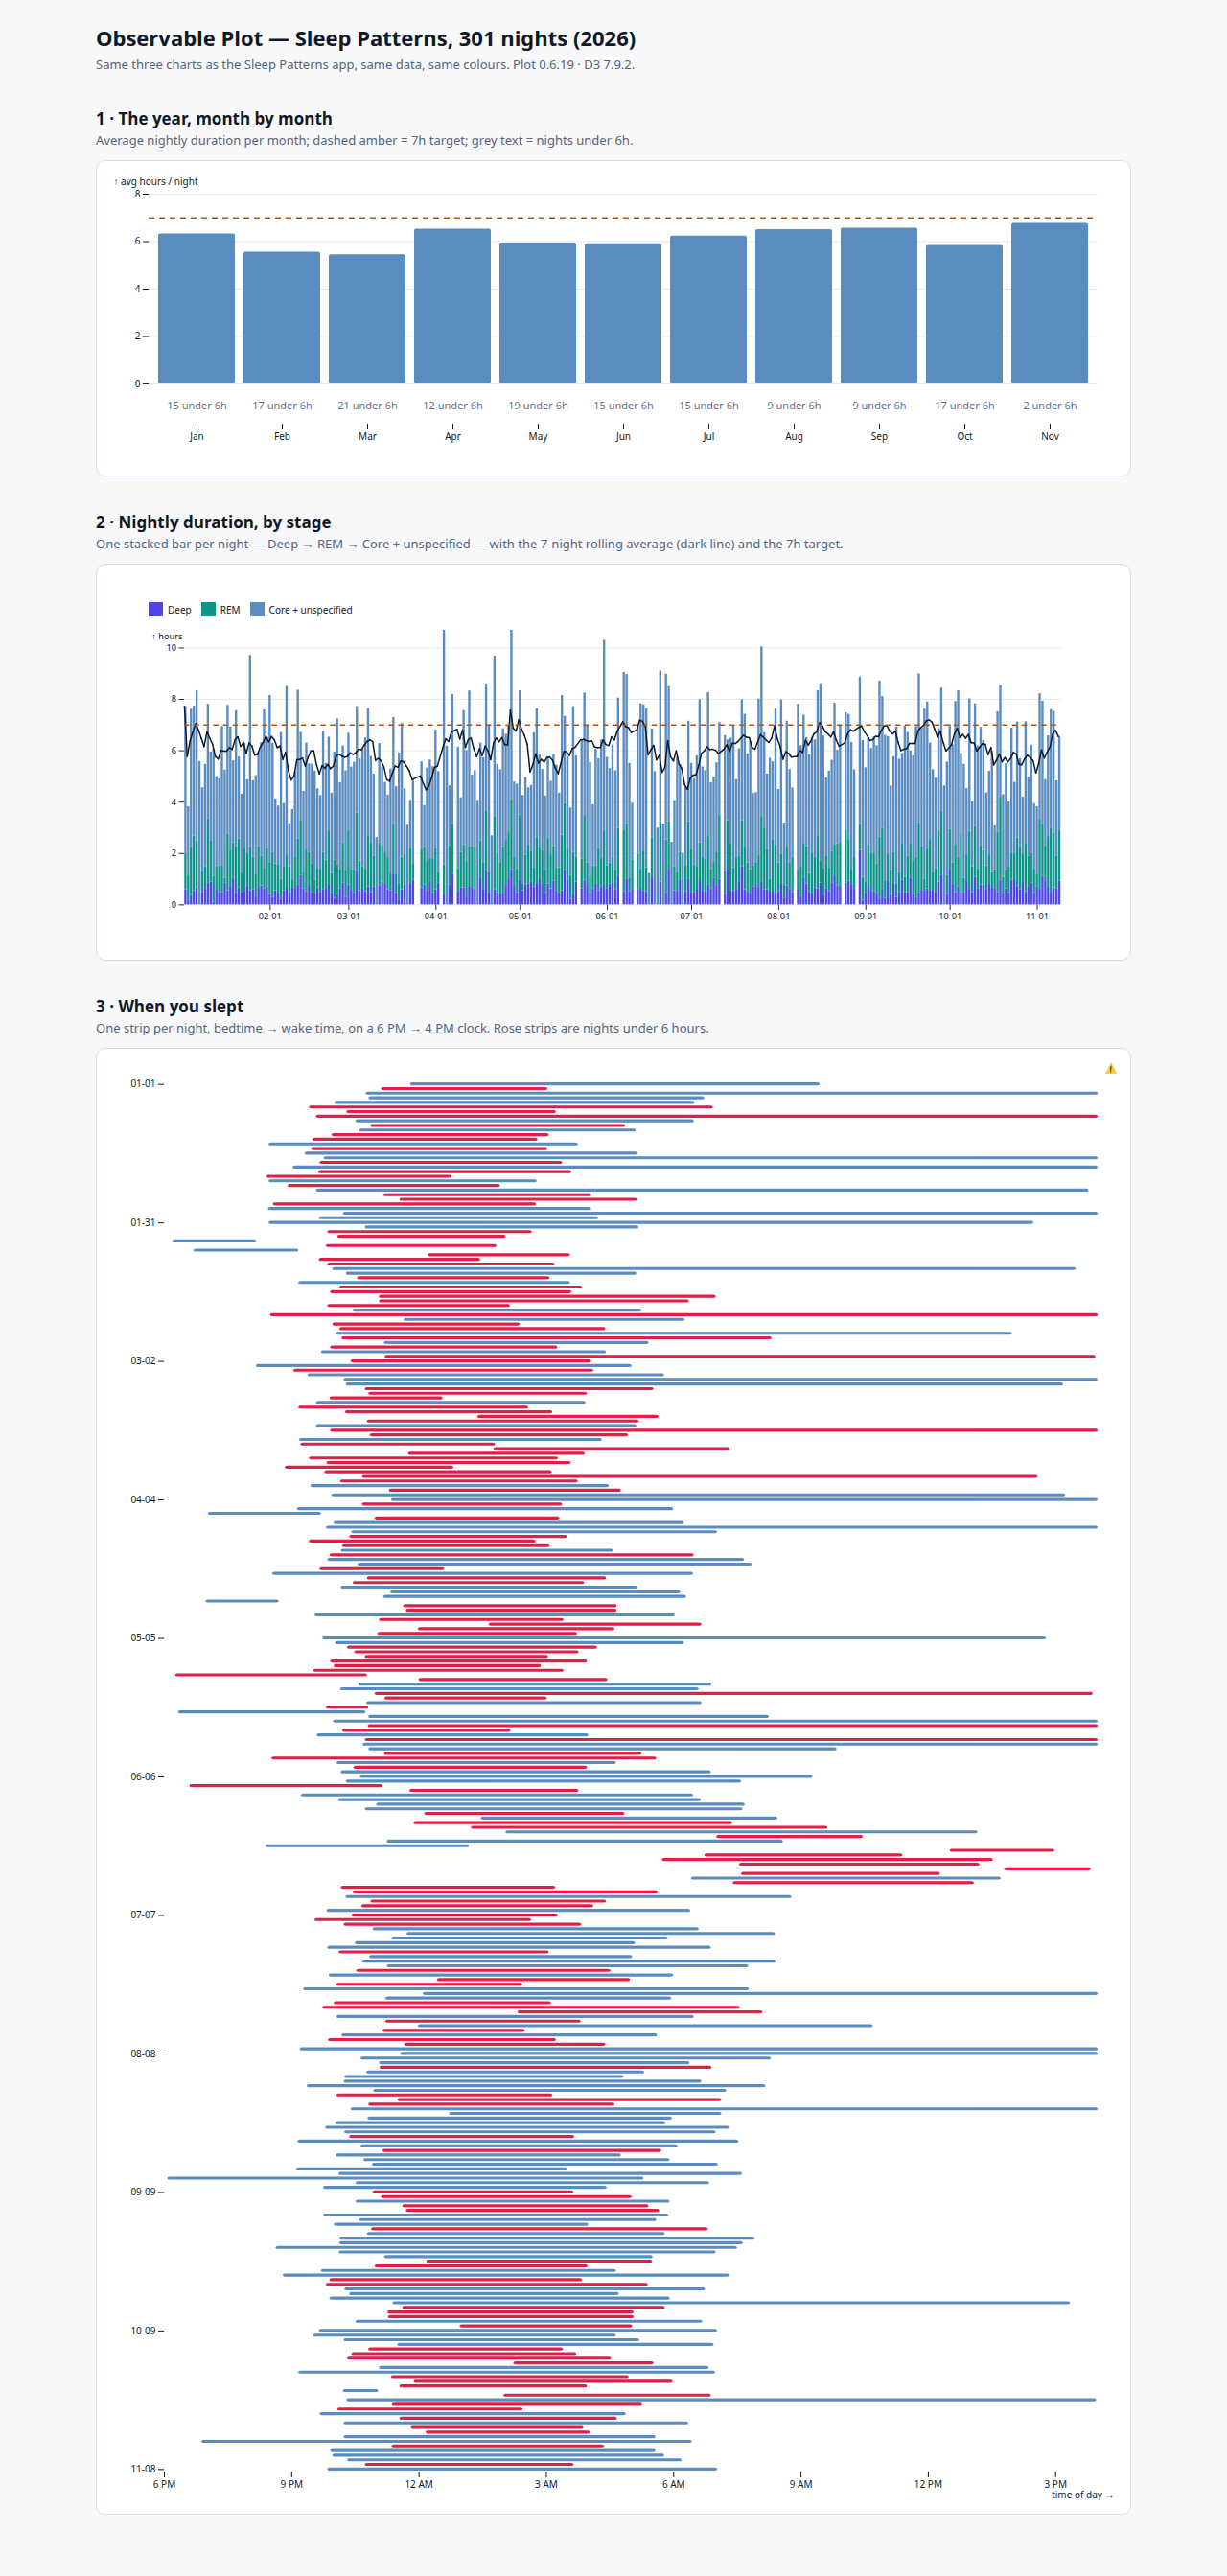
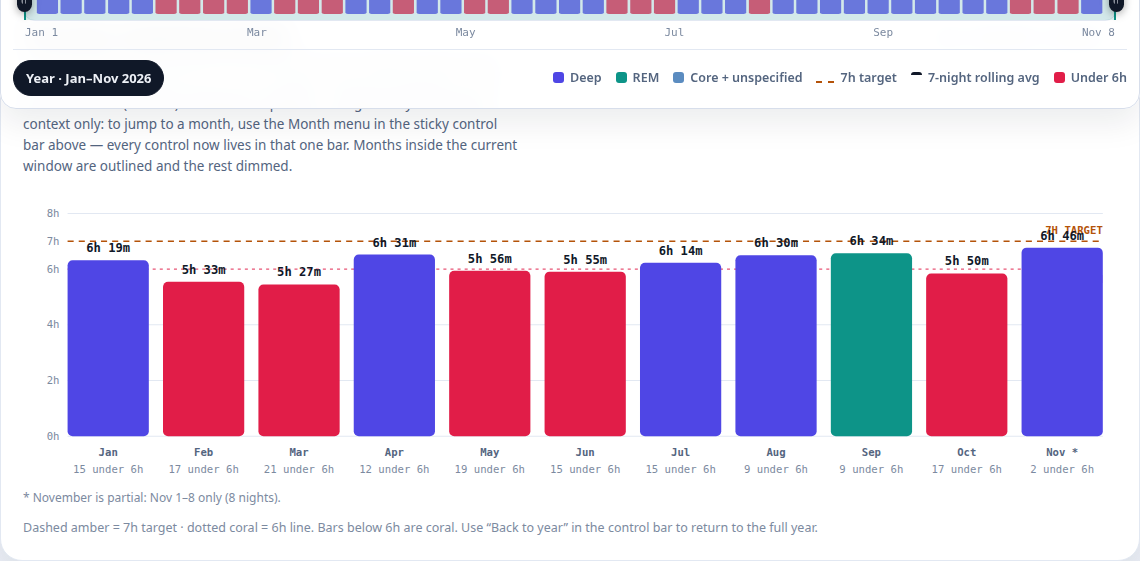
- "The year, month by month" — average nightly duration per month (bars), 7 h target rule, "N under 6h" sub-labels. App:
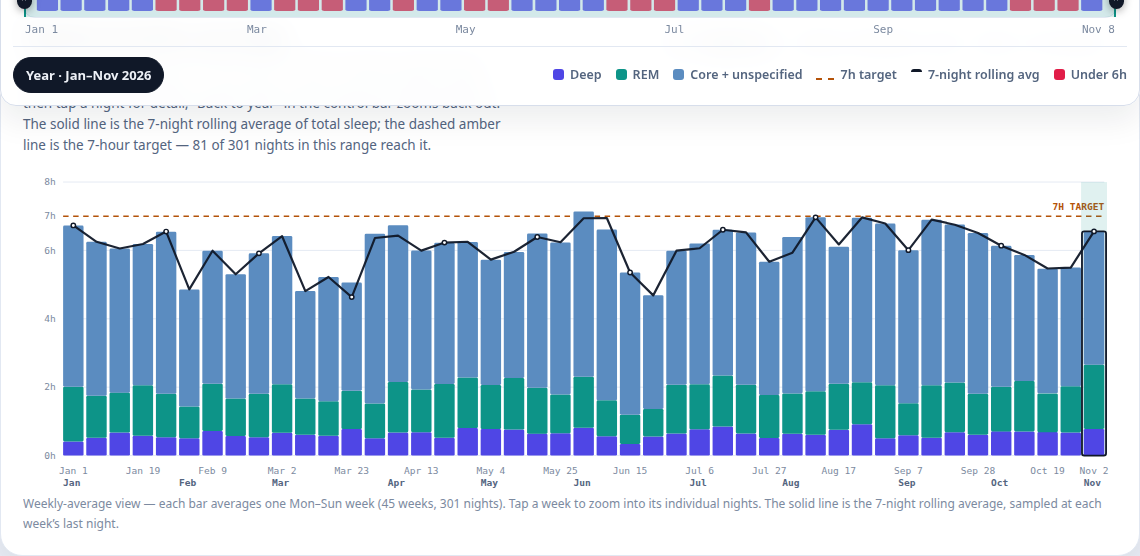
renderMonthly(). - "Nightly duration, by stage" — one stacked bar per night, Deep → REM → Core + unspecified, 7-night rolling-average line, 7 h target rule. App:
renderDurationChart()(at year scale the app aggregates to weekly bars — its "semantic zoom"; both libraries were tested on the harder nightly form, which the app also renders when zoomed). - "When you slept" — one strip per night, bedtime → wake time on a 6 PM → 4 PM clock (1,320 min window), rose if under 6 h. App:
renderTimingChart().
Same data, same colours in both test pages (app light-theme tokens: Deep #4f46e5, REM #0d9488, Core #5b8cc0, short #e11d48, target amber #b45309).
Spec / code size per chart
Measured between markers in each test page; app figures counted from source (render function only / with its chart-specific helpers).
| Chart | Vega-Lite spec | Plot code | App hand-drawn (render fn) | App (+ helpers) |
|---|---|---|---|---|
| 1 · Monthly | 31 lines · 1,537 B | 19 lines · 980 B | 40 lines · 3,189 B | 40 · 3,189 B |
| 2 · Duration by stage | 37 lines · 1,788 B | 19 lines · 1,059 B | 90 lines · 6,759 B | 141 · 9,204 B |
| 3 · Timing strips | 15 lines · 786 B | 12 lines · 601 B | 41 lines · 3,462 B | 47 · 3,629 B |
| Total | 83 lines · 4,111 B | 50 lines · 2,640 B | 171 lines · 13,410 B | 228 lines · 16,022 B |
Plot's code is ~40 % smaller than Vega-Lite's specs for identical charts; both are 3–6× smaller than the hand-drawn code (which additionally carries the app's brush/zoom/selection interaction system, not counted here and not reproduced by either library — see Stack fit).
Page weight (library JS, minified builds as loaded by the test pages)
| Stack | Files | Raw | Gzip |
|---|---|---|---|
| Vega-Lite | vega.min.js 515,242 + vega-lite.min.js 252,198 + vega-embed.min.js 60,630 | 828,070 B | 278,128 B |
| Observable Plot | plot.umd.min.js 211,860 + d3.min.js 280,622 (UMD requires D3 as a global) | 492,482 B | 161,968 B |
Plot's stack is ~42 % lighter gzipped. (Shared data file, 118 KB JSON, excluded from both.) For scale: the entire hand-drawn Sleep Patterns app — all charts, table, brush, insights — is a 135,818 B single HTML file with zero dependencies.
Quality notes (screenshot evidence)
Chart 1 — Monthly. Both correct at 1280 px after fixes (values verified against SUMMARY: Mar lowest at 5.45 h / 21 under 6 h; Nov 6.77 h / 2 under). Vega-Lite kept chronological order by spec (sort on the month field). Plot silently sorted the months alphabetically (Apr, Aug, Feb, Jan…) on first render — a wrong chart that looks right; fixed with an explicit domain. At 390 px, both pages' "N under 6h" sub-labels collide horizontally — a wash; neither library protects you from label crowding you designed in.
Chart 2 — Duration by stage. Both stacks render in the app's order (Deep bottom → REM → Core+unspec top), rolling lines from the two independent implementations (Vega-Lite window transform; Plot windowY) agree with each other and with the data, including the same outlier spikes (max night 12.15 h). Vega-Lite's x-axis is dense (a label every ~8 days); Plot's true time axis thins itself to monthly ticks and reads cleaner. At 390 px the picture inverts: Vega-Lite's bars stay dense and readable as texture, Plot's rects (with insets) wash out pale.
Chart 3 — Timing strips. Strip-for-strip identical patterns in both, including the 18 nights whose recorded wake time runs past the app's 4 PM window edge (the app clamps; Plot needed the same clamp written by hand, Vega clips silently). Vega-Lite shows a date tick every ~4 days; Plot only the ticks you enumerate.
Warnings as UI defects. Plot draws a ⚠ glyph on the chart when it detects ISO date strings on a scale and suggests parsing them to Dates. Chart 2 was fixed the intended way (real Dates — which then required switching bars from barY to rectY with x1/x2, because barY rejects a time scale: "scale incompatible with channel: time !== band"). Chart 3 keeps string dates deliberately — a time-scale y-axis would invert the app's top-down chronological reading order — so the shipped Plot page still shows one ⚠. Vega-Lite raised no warnings anywhere.
Interactivity. Vega-Lite: rich HTML tooltips work out of the box via vega-embed (verified live: "Month Apr · Avg 6.52 · Nights < 6h 12 · Nights 28"). Plot: the title channel yields native SVG <title> tooltips (verified values correct) — functional but bare; Plot's nicer tip overlay exists but is a separate opt-in. Neither reproduces the app's linked selection/brush out of the box; Vega-Lite's selection grammar could grow toward it, Plot 0.6 has no equivalent framework.
Responsiveness. Vega-Lite width: 'container' + vega-embed resizes declaratively — after one trap (below). Plot has no container sizing: the page passes an explicit pixel width and re-renders on a debounced resize listener (glue code, counted in the page but not in per-chart specs).
Traps hit (both libraries failed once, differently)
- Vega-Lite / vega-embed: with
width: 'container', vega-embed makes its target inline-block and measures the shrunk box — all three charts rendered 28 px wide until the target element got an explicit CSSwidth: 100%. Fails loudly (you see a tiny chart), one-line fix, but it is the first thing a new adopter hits. - Observable Plot: (1) categorical scales sort alphabetically by default — fails silently (wrong month order, plausible-looking chart); (2) temporal bars need the
rectY+ x1/x2 pattern after two failed attempts (barY+ time scale, thenintervalon the mark, then on the scale — all rejected). Both fixed, both documented here so they're one-line non-events next time.
Stack fit (Ros's apps: Vite/React Spaces + single-file HTML)
- Vite/React: both embed via a ref + effect. Plot returns a plain DOM node (the most natural fit, no lifecycle); Vega-Lite needs the embed call (or react-vega) but then manages resizing and tooltips itself. Vega-Lite specs are JSON — generatable, diffable, schema-validatable, and renderable headlessly (Vega → SVG/PNG in Node) for static report/briefing images; Plot needs a DOM.
- Single-file HTML: Plot wins on weight (162 KB gz vs 278 KB gz) — relevant to the Sleep Patterns pattern of one self-contained file; neither comes close to the hand-drawn app's zero-dependency 136 KB.
- Interaction headroom: the baseline app's signature moves (brush window, semantic zoom, cross-chart selection) are a Vega-Lite-shaped problem (selections/signals) and largely out of Plot's scope.
Effort log (honest, 2026-11-20, from file timestamps + session record)
- 13:30 — data extracted and reconciled (301 rows, all checks green).
- ~13:31–13:35 — baseline chart code measured; Vega-Lite page written; first screenshots: baseline app ✓, Vega-Lite charts rendered but 28 px wide (container trap).
- ~13:37 — Plot page written; first render correct except alphabetical months.
- ~13:45–14:00 — Vega-Lite CSS fix; re-shots at both widths clean.
- ~14:00–14:20 — Plot fixes: month domain (1 line); temporal bars took three attempts (~15 min) before the
rectYpattern; timing clamp; final screenshots + tooltip probes. - Time-to-first-chart: Plot ~5 min (with a silent ordering bug); Vega-Lite ~5 min (with a loud sizing bug). Time-to-correct-chart: Vega-Lite ≈ 25 min, Plot ≈ 45 min, almost all of it Plot's temporal-bar detour.
Verdict — survivor: Vega-Lite
Observable Plot is the better code; Vega-Lite is the safer default. Plot wins three measured categories outright — spec size (2,640 B vs 4,111 B), page weight (162 KB vs 278 KB gz), and DOM-native embedding — and its time axis is prettier. But in this test Plot produced the only silently wrong chart (alphabetical months), pushed back twice on the most common data shape in Ros's apps (ISO dates), and leaves a warning glyph on a chart for a defensible modelling choice. Vega-Lite's one trap fails loudly and fixes in one CSS line; after that it gave correct-by-default ordering, declarative transforms (fold + window did the two hardest jobs), free rich tooltips, free container responsiveness, and a spec format that is data — diffable, validatable, headlessly renderable — which matches how Ros's agent-built apps and briefings actually get produced. For a default pick, loud failure + correct defaults beat smaller + lighter.
Vega-Lite: Adopt as the default charting library for data apps.
Observable Plot: Reuse later — reach for it when payload dominates (single-file pages), when a chart is hand-tuned product UI rather than a generated report, or when its mark composition fits better; always pass categorical domains explicitly and use rectY for temporal bars.
Neither library replaces the hand-drawn approach for a flagship page like Sleep Patterns itself, where the interaction system is the product — but for the next data app that needs three good charts by tonight, Vega-Lite is the pick.
Test record
- Subjects: Vega-Lite 5.23.0 / Vega 5.33.1 / vega-embed 6.29.0 · Observable Plot 0.6.19 / D3 7.9.2 · Baseline: hand-drawn SVG in Sleep Patterns (
renderMonthly,renderDurationChart,renderTimingChart). - What ran: extracted the app's real 301-night dataset; built the app's three charts in both libraries on identical data/colours; screenshot both pages at 1280 px and 390 px plus the app's own three panels as baseline; verified tooltips live in both; measured spec size and library weight.
- When: 2026-11-20.
- Outcome: both libraries reproduced all three charts correctly after fixes; dataset reconciled at 301 nights (not the expected ~482); Vega-Lite wins the pair on correctness-by-default and platform fit despite larger specs and payload.
- Output reference: this folder —
report.md,vegalite.html,plot.html,sleep-nights.json,sleep-nights.csv,vegalite-1280.png,vegalite-390.png,plot-1280.png,plot-390.png,baseline-monthly.png,baseline-duration.png,baseline-timing.png. - Reuse status: Vega-Lite — Adopt (default charting pick for data apps). Observable Plot — Reuse later (lightweight single-file pages, hand-tuned charts; mind the domain-ordering and temporal-bar traps). Hand-drawn SVG — keep for flagship interactive pages only.