React Flow vs hand-built My Muse Map — head-to-head report
Track B, FINDS - TESTS slate 2. Built and verified 2026-11-19 (PT). The live Muse Map app was not modified; this is a standalone prototype in app/.
Dataset used + reconciliation
Source: the full job-level v5 dataset, extracted from the live map itself. The My Muse Map (slug my-muse-map, static Space) embeds its entire audit dataset as a var DATA = [...] literal in ~/workspace/ts-spaces/my-muse-map/index.html (line 296, re-audited Nov 19, 2026 · 5:51 PM PT). extract-data.mjs evals that literal and slims it to dept/team/job names, statuses, team chat lists, and job home chats → map-data.json (copied into the app as app/src/data.json). No fallback was needed; the Archify v5 spec was not used.
Reconciliation — exact, no flags:
| Level | Expected (v5) | Extracted | Rendered in app (DOM count) |
|---|---|---|---|
| Departments | 8 | 8 | 8 |
| Teams | 36 | 36 | 36 |
| Jobs | 85 | 85 | 85 |
| Statuses | Live 8 / Assisted 67 / Gap 10 | Live 8 / Assisted 67 / Gap 10 | — |
| Total nodes | 130 (1 root + 8 + 36 + 85) | — | 130 |
| Edges | 129 | — | 129 |
Per-department jobs: Health & Body 8 · Money & Admin 11 · Career 10 · Family & Legal 4 · Builds & Code 16 · Knowledge & Finds 19 · Home & Gear 6 · Brain & Memory 11 = 85.
What was built
- Stack: Vite (React template) +
@xyflow/react13.0.2 +dagre0.8.5.npm run buildpasses (only upstream rolldown chunk-size / directive warnings). Built bundle ~596 KB inapp/dist. - Graph: root "The Brain — My Muse" → 8 department nodes → 36 team nodes → 85 job nodes, dagre left-to-right tree layout, re-run on every collapse/expand.
- Files / LOC:
app/src/App.jsx207 lines (graph model, layout, custom node, HUD, detail panel — everything),app/src/App.css60 lines,index.css2 lines, templatemain.jsx10 lines. Plusextract-data.mjs(31) and the screenshot harnessapp/screenshot.mjs(35). The whole interactive graph app is effectively one 207-line file + 60 lines of CSS. - Styling language mirrors the hand-built map: Live = filled cream with copper/amber border, Assisted = neutral white/grey, Gap = hollow, dashed, dimmed to 62%. Root is a dark "Brain" node; departments are heavier-bordered containers of the tree.
Effort (honest log)
- Data discovery + extraction: ~10 min. One failed inline
node -e(syntax error in a one-liner) → rewrote asextract-data.mjs, worked immediately. Counts reconciled on first successful run. - Scaffold + installs: ~40 s, zero errors (
npm create vite,@xyflow/react,dagre). - App code: written in one pass;
npm run buildpassed on the first attempt. The graph model, collapse logic, and detail panel needed no debugging. - Screenshot/verification phase: 5 iterations, and the friction was in my harness, not React Flow —
- screenshot script placed outside
app/→playwright-corenot resolvable (module resolution follows the script, not cwd); - a sed patch collided with the script's own
URLidentifier; - the task brief's
chromium-1255path doesn't exist on this box —chromium-1254does (used that, with--no-sandboxvia playwright-core'sexecutablePath, no wrapper needed); - Playwright's
dblclick()actionability checks fail at ~0.1 zoom (node is 21 px wide, viewport transform fights scroll-into-view) → switched to rawpage.mouse.dblclickat the node's bounding-box centre; - first screenshots were pure white — root cause was my own bug: the rewritten
App.jsxdropped the template'simport './App.css', so.app-shell/.react-flowcollapsed to height 0 and clipped everything. One-line fix, rebuild, all shots good. - Total wall-clock for the build + verification loop: roughly 45 minutes, most of it the screenshot harness.
Interaction inventory — free vs hand-written
Came free from React Flow (zero or one-line cost):
- Pan / zoom (mouse, wheel, pinch), zoom-to-cursor
- Controls (zoom in/out, fit-view, lock) — one component
- MiniMap (pannable + zoomable) — one component
- Background dot grid — one component
- Node selection highlight, node dragging, edge rendering (clean bezier fans), fitView incl. fit-to-a-set-of-nodes (powers the double-click focus), viewport animation
Hand-written (all small): - The data flattening (DATA → node records with parent links), ~30 lines - Dagre layout glue, ~20 lines (React Flow does not lay out trees for you — this is the one real gap an agent must fill, and dagre fills it in a dozen lines) - One custom node component (name + meta + collapse toggle button), ~25 lines - Collapse/expand state + visible-subtree computation + re-layout, ~25 lines - Click detail panel (name, kind, status, parent, home chat / team chats, child count), ~20 lines of JSX - Status styling, ~15 lines of CSS
Nothing in the "hand-written" list was hard or library-specific; it's the same glue any graph UI needs.
Legibility verdict (from the screenshots)
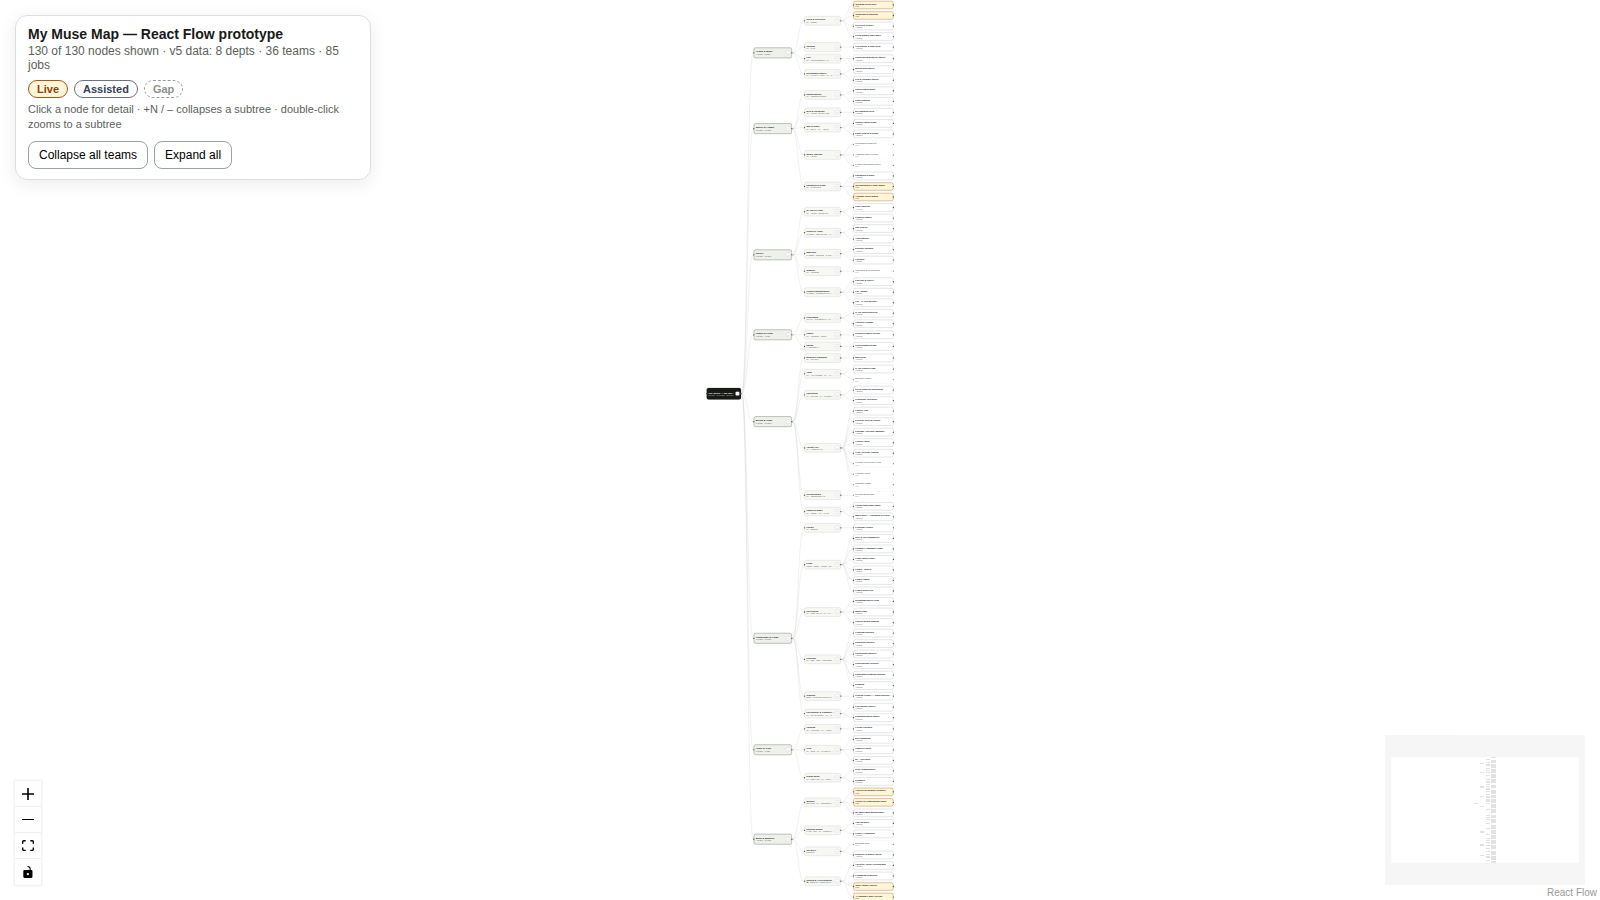
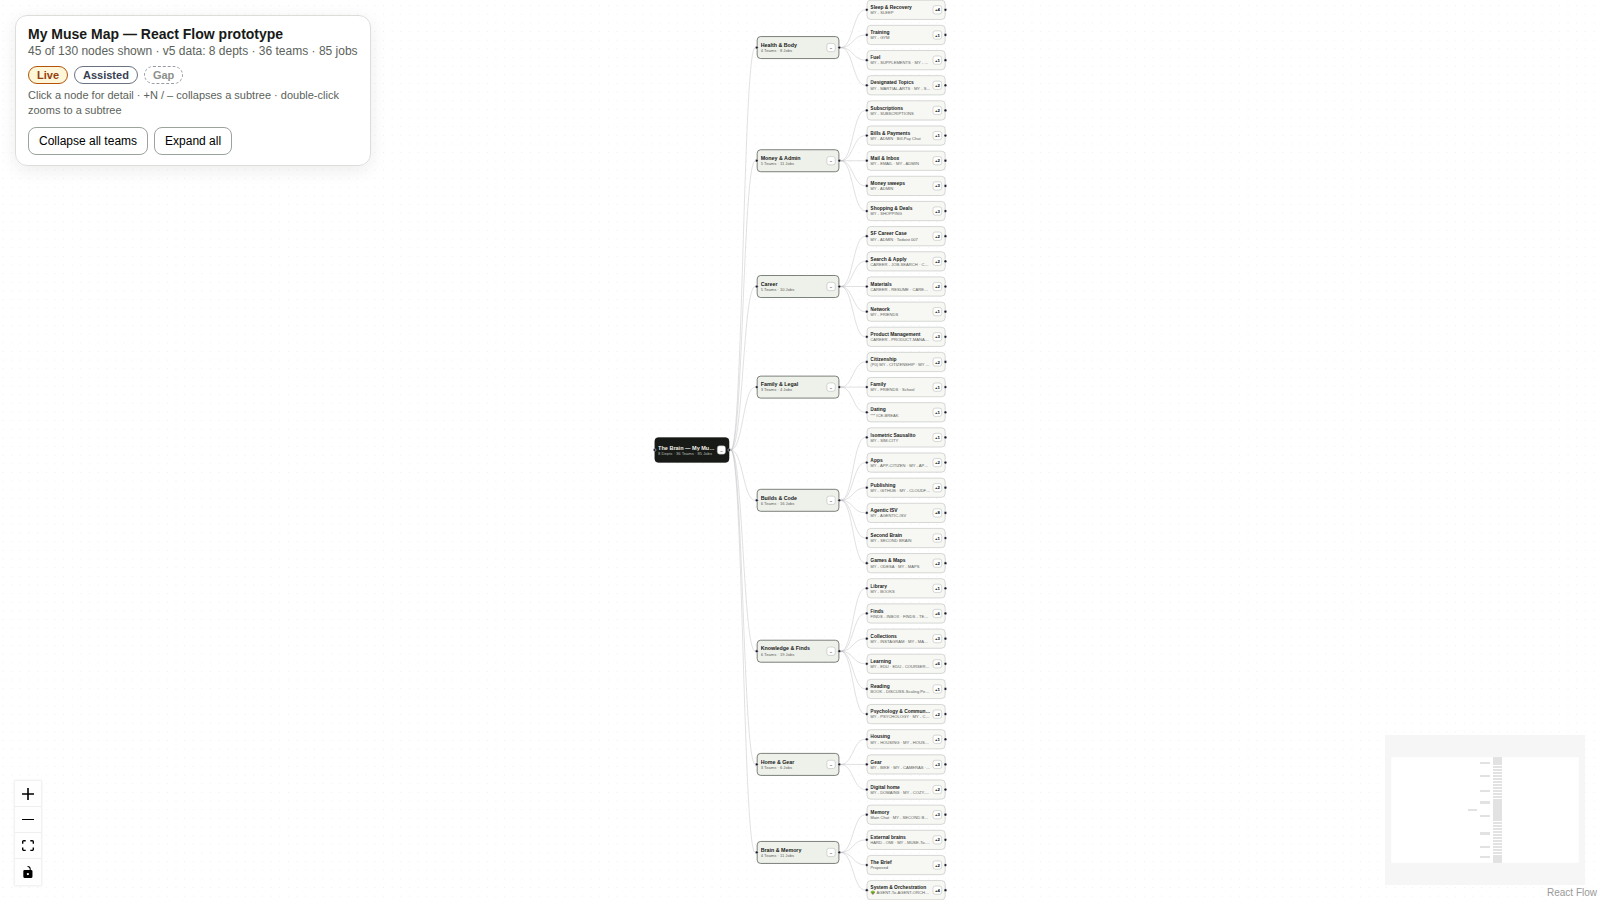
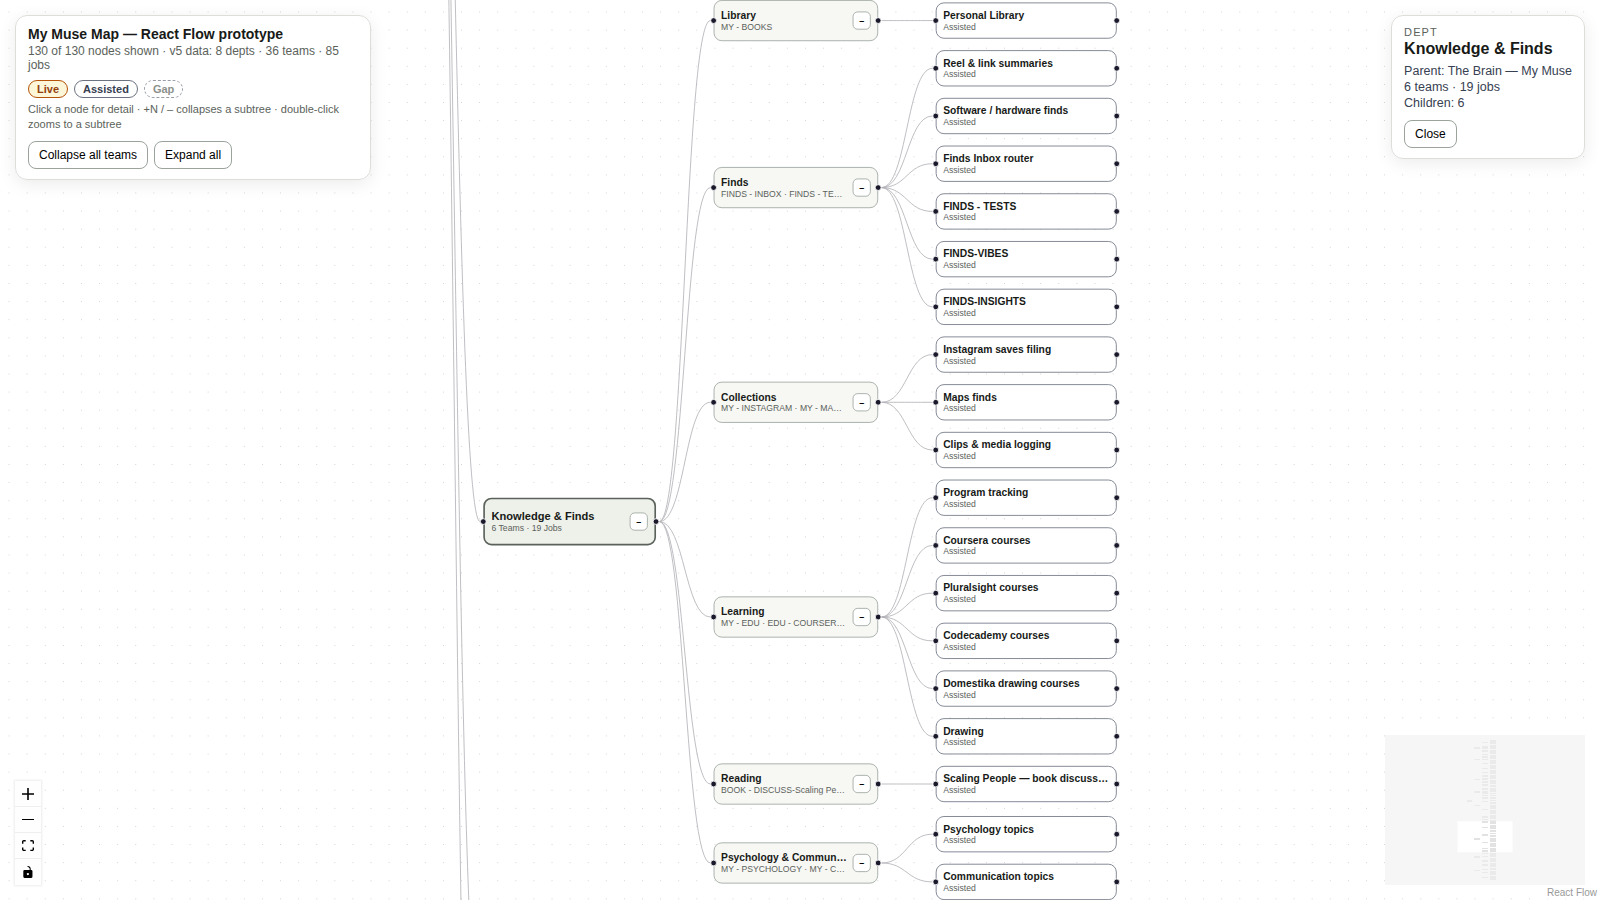
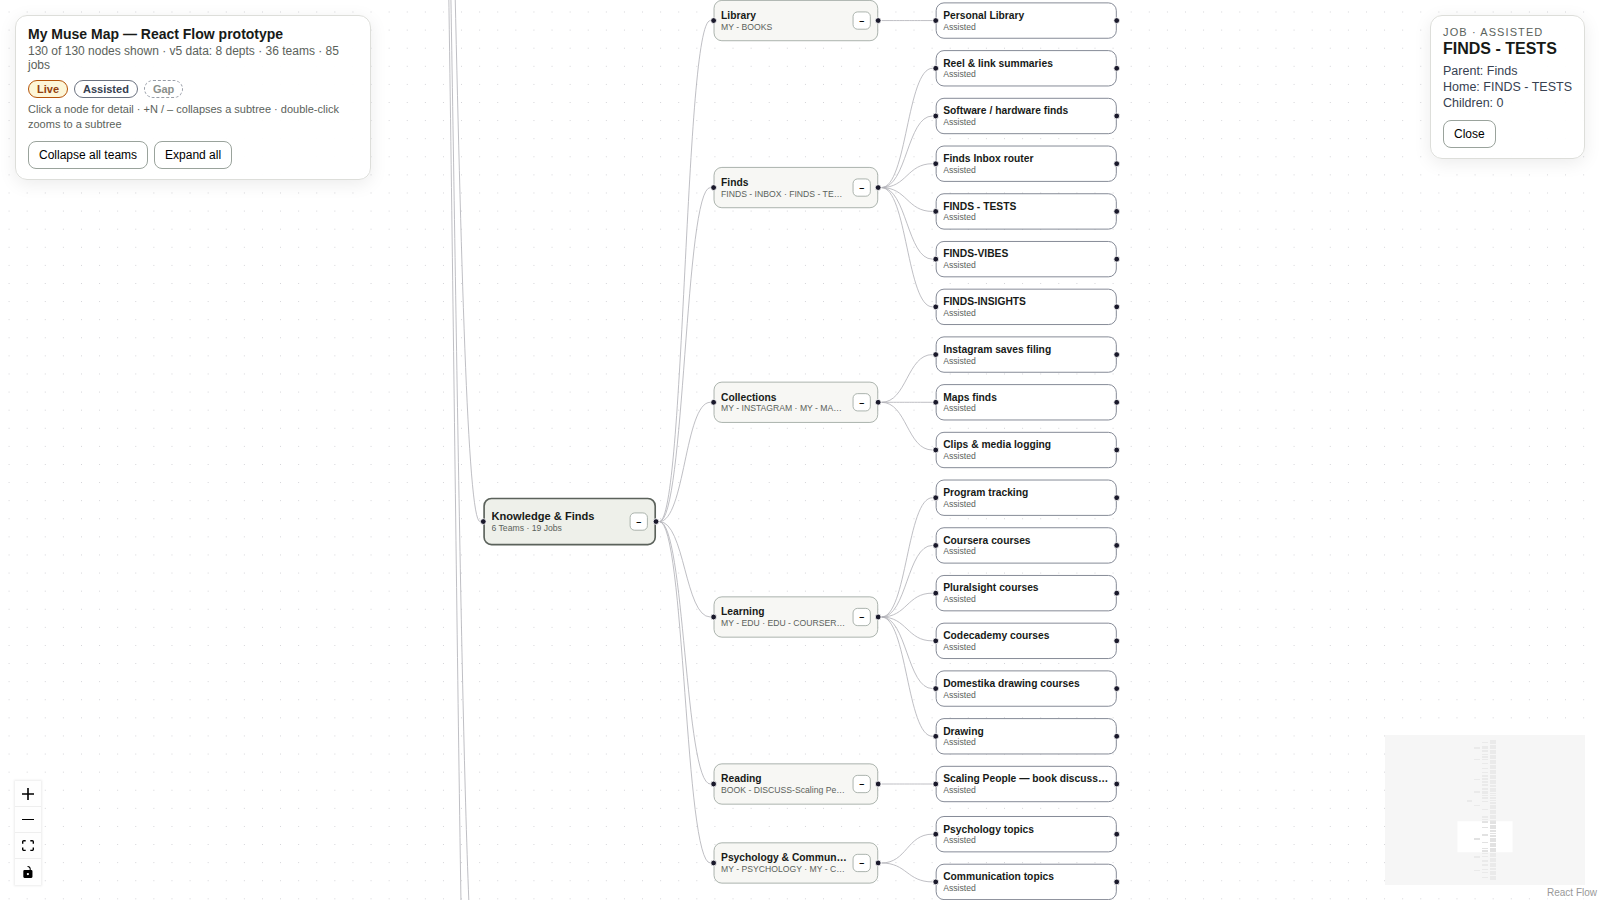
screenshot-full.png— all 130 nodes fitted at 1600×900: illegible. Fit zoom is ≈0.10; the LR tree is only 4 ranks wide but ~85 jobs tall, so the graph renders as a narrow vertical strip using ~15% of the viewport width, with labels at 1–2 px. Zero label overlap and zero edge crossings (it's a tree — dagre's fan-out is clean), and the cream Live nodes read as colour accents, so the shape communicates (8 dept clusters, where the Live jobs sit) — but no word can be read. As an overview it is a texture, not a map.screenshot-collapsed.png— "Collapse all teams" (130 → 45 nodes): better, still not legible at fit. Department names are readable, team names are ~5 px and squinted-at best. Collapse helps navigation, it does not make the full graph fit-to-screen readable, because the tree's problem is height, not density.screenshot-department.png/screenshot-detail.png— at department zoom, fully legible. Double-clicking Knowledge & Finds (6 teams, 19 jobs — the largest department) fits its subtree at a zoom where every job label, status line, and team chat list is crisp; no overlaps, no crossings, edges trace cleanly from dept → team → job. The detail panel for the FINDS - TESTS job shows name, status, parent team, and home chat correctly. This focus-and-inspect mode is where React Flow is genuinely good.
Net legibility answer: collapse is necessary but not sufficient; the working pattern is collapse + focus-zoom per department, exactly the interaction the hand-built map already implements in its own way (overview → fan into one department → tap a job). React Flow does not magically solve 130 nodes on one screen — nobody does — but its built-in fit-to-subtree makes the focus step one double-click with animation, for free.
Draft verdict
For the My Muse Map itself: tie leaning lose — do not rebuild the live map on React Flow. The hand-built map's radial "galaxy" overview (Brain at centre, departments orbiting, one department fanned at a time) is a deliberate, bespoke answer to the same legibility wall, and it doubles as a designed one-page document (ledger, search, status filters, the SkillTree look Ros chose). The React Flow tree gives up that identity and the document qualities, and at full fit it's less legible than the radial overview (a skinny strip vs a composed galaxy). What React Flow would save in maintenance is real but small — the map changes a few times a month via re-audit, and its data is a static literal either way.
For the Orchestrator's job-routing view (secondary subject): React Flow wins, clearly. That view is an operational graph, not a document: live routing between chats/agents, paths to trace, subtrees to collapse when a branch is stuck, nodes to click for state. Pan/zoom, minimap, collapse, fit-to-subtree, and click detail are precisely its requirements, and this prototype shows an agent can stand the whole thing up in ~270 lines with the interaction layer essentially free. If the Orchestrator gets a UI, build it on React Flow.
Generalised: React Flow is the right default for working node graphs (operational, explored by zooming and collapsing) and the wrong tool for presentational one-page maps (composed, read at a glance). Effort is not a differentiator — the build was one file, one pass; the library's value is the interaction layer, not code savings.
Test record
- Subject: React Flow (@xyflow/react 13.0.2) vs the hand-built My Muse Map graph view
- Date: 2026-11-19
- What: Built a standalone Vite + React Flow + dagre prototype of the Muse Map graph on the full v5 dataset extracted from the live map's own
index.html(130 nodes / 129 edges, reconciled exactly: 8 depts, 36 teams, 85 jobs, Live 8 / Assisted 67 / Gap 10), with pan/zoom, MiniMap, Controls, map-language status styling, subtree collapse/expand, double-click focus, and click detail.npm run buildpasses; rendered DOM verified at 130 nodes / 129 edges; collapse verified 130 → 45 nodes; screenshots at full fit, collapsed, department zoom, and job detail (Playwright, chromium-1254, 1600×900). - Outcome: Success as a test. Interaction layer essentially free; graph code one 207-line file, written in one pass. Full-fit view illegible (zoom ≈0.10, tall skinny tree) — collapse + per-department focus is required, where it becomes fully legible with zero overlaps/crossings.
- Output: This report +
app/(source and built dist) +map-data.json+screenshot-full.png,screenshot-collapsed.png,screenshot-department.png,screenshot-detail.png, all in~/workspace/finds-tests/react-flow-muse-map-2026-11-19/ - Reuse status proposal: Reuse later — for the Orchestrator job-routing view (build on React Flow if/when that UI happens). Not adopted for the Muse Map itself; the hand-built radial map stays.